
I spent considerable time a year ago figuring out the various cost effectiveness tests that are applied to energy efficiency programs. Since they are so bizarre, it took me almost an hour again to relearn it. Thankfully, I documented it in language I can understand, and no one squawked about anything being wrong, so I’m going to believe it was right. For a refresher, that was Energy Efficiency Benefit/Cost Tests and a Handful of Excedrin.
I won’t recycle all that information, but in this Rant I will advance the discussion to demonstrate that the usual benefit/cost test, the Total Resource Cost test, is as fantastic (meaning fantasy-like rather than great(!)) as the crazy dreams I’ve had where I’m playing professional tennis or fighting Iron Mike Tyson[1].
The Total Resource Cost (TRC) test compares the cost of acquiring the efficiency resource (incentives funded by ratepayers plus participant out-of-pocket costs) to all direct benefits (avoided transmission, distribution, generation, and all natural resources, as applicable). The cost and savings are measured in current dollars.
Per my readings, there is a big fat gray area between the TRC and what is known as the Societal Cost Test (SCT). This is depicted in the images below.
The TRC starts with relatively concrete, as reasonably can be established, costs and savings for energy efficiency programs. Between the TRC and the SCT is a continuum of other benefits, also known as non-energy benefits, aka NEBs.
These NEBs start with more concrete benefits including things like maintenance and other fuel or resource savings such as natural gas and water. They get more abstract and include comfort savings, which in business makes sense. People are more productive when comfortable. Measuring its value is another story.
What is comfort at home worth? I would say negative economic impact if anything. Few people reading this would remember coping mechanisms for extreme hot weather. What to do? Go to the movies where it’s air conditioned! This spurred economic activity. Now to some degree the opposite is true. Who wants to get sweaty or freeze their keister off when they can just stay home and be surveilled by Facebook or watch kittens chase dogs on You Tube?
When advocates really start scrapping for savings, they get into impossible-to–measure, true societal benefits. I provided an example of this back in Clean Power Plan Arms Race where the EPA ascribed societal benefits based on reduced mercury emissions; resulting in reduced mercury ingestions by pregnant women who ate mercury tainted fish caught in their spare time at a lake near them; avoiding lower IQ of their progeny; who are able to go through life and earn an extra 1.5 cents per hour during their working years[2]. This is on the societal blarney end of the TRC-SCT spectrum – a quantification using outrageous presumptive proportions.
The conclusion for this round is that not even the TRC is uniformly used across the country, or North America for that matter.
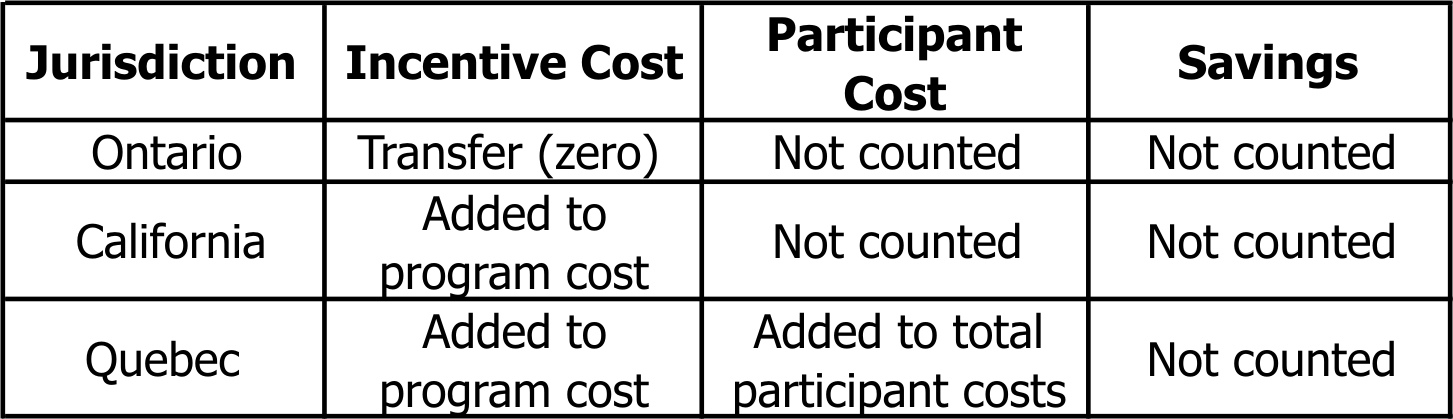
The TRC test includes spin-the-bottle net impacts; or not. Net impacts include effects of free riders and free drivers. For a refresher on free riders, see Freeridership – Confessions of a Bad Person. According to a recent report by Dunsky Energy Consulting, the “costs” of free riders are handled with vast difference from one jurisdiction to the next. Examples are summarized in the following table.
Furthermore, in a discussion with one multi-decade industry expert, certain jurisdictions (starts with a C and ends with an A) take a particularly harsh stand on attribution – the free rider thing. Some states don’t even perform attribution, or net-to-gross analyses.
Here is a novel idea: why not skip participant costs and NEBs entirely for assessing program cost effectiveness? Customers have all sorts of reasons for implementing projects (NEBs), and why does it matter what they pay for those NEBs? Are utilities required to include in their financial analyses the impact on area property values when they build a wind farm? Do they include revenue for land-owners to provide access to wind turbines in their ben/cost analysis? Are federal subsidies to wind farm owners in Iowa, Texas, and California from taxpayers in the Dixie South included?
It isn’t just wind farms. Consider similar NEBs for nukes and natural gas combined cycle plants. How about uncertainty of real estate values for 20-year rooftop solar leases for homes people own for an average of 5-7 years? Or what about the built-in rate-base charges low-income customers pay in their monthly bills for a tax write-off for wealthy “tax equity investors”? Ooooh! I rest my case, for now.
And don’t forget, if you enjoy the outrageous thinking that goes into each Energy Rant post (or if you don’t), please participate in our survey. We want to continue providing information our readers find useful and enjoyable. As a thank you for your participation, you will be entered to win a $100 Amazon gift card. Survey will close Monday, November 9th at 11:59 CST. Winner will be announced Tuesday, November 10th. Take the survey now.
[1] I don’t even play golf, let alone tennis, and I think I used toy boxing gloves at a friend’s house one time when I was eight years old.
[2] I wish I could generate scenarios like this to demonstrate things, but it is beyond my reach.
Photo sources:
http://www.ecocem.ie/technical,working.htm
http://jigsawparadise.com.au/ravensburger-super-sized-floor-jigsaw-puzzles-fairy-land-24

Interesting rant, Jeff. As I’m sure you know, these test ultimately derive from EE practitioners’ attempts in the early 80s to come up with a way to evaluate cost effectiveness of energy efficiency investments relative to building and operating power plants. Many utilities that still use integrated resource planning and successfully include energy efficiency in their analyses share your implicit enthusiasm (“Here is a novel idea: why not skip participant costs and NEBs entirely for assessing program cost effectiveness?”) for the Program Administrator Cost test (utility test). Rarely do IRPs include NEBs and participant costs in their analyses of how EE compares to supply-side resources … those type of analyses are generally reserved for the “DSM side” of the utility house.
In any case, one can certainly include NEBs and other “social” attributes (such as social discount rates) in their cost effectiveness analyses but the more you do, the further one gets away from the true source of the tests themselves (omg, sounds like strict constructionism).