Recently, the American Council for an Energy Efficient Economy issued a report, “The State of the Utility Bill” and I thought, “now there is a topic for plenty of discussion.” No, that was no joke, although there was an interesting finding that I found to be very hilarious: All of the ~100 bills analyzed in the study (100%) included the amount due to the utility from the customer. I would say not having the amount due would have its disadvantages. (that WAS a joke)
I’ve witnessed and studied many issues regarding end user understanding of energy, energy consumption, and end uses – e.g., lighting. Our industry reminds me a bit of the political talking heads on TV. They hyper analyze things for which only they or a political news addict, and not the common voter is going to notice or care about. An example might be a response to a question on a hypothetical crisis in the Middle East. The pundits will quibble over the order of responses or their indicated aggressiveness as suggested by the candidate or even the question. Meanwhile, the average viewer is looking only for whether the recommendation would include blowing the enemy to kingdom come, finger-wagging sanctions, nothing, or withdrawing from the region altogether.
Likewise, there is a disconnect between what we think end users think or know and how they actually think and what they know. The utility bill is damn complicated to the average end user and even more so than the average energy professional realizes. The bill might include different seasonal rates, tiers, time of use, demand charges, ratchet clauses, and even more complex algorithms.
I learned long ago that when we need energy records for a customer, the best form is to get copies of actual bills and a close second is the utility’s CIS (customer information system) data. When the customer says, “Oh, I have all that in a spreadsheet. I can just give that to you.” I cringe because they won’t have what we need or it will be wrong because they can’t pick the right numbers off the bill – like finding Waldo. I don’t want it. It’s virtually guaranteed to be wrong.
The ACEEE report indicates just over 90% of the bills include comparison to the previous month’s consumption. I can’t find that Waldo on my bill. I do have comparison to year-ago consumption, the next most common element found in the study.
Average daily usage. Now what does that tell anyone? Anyone? It doesn’t even tell me anything, except that’s the form in which I am provided for the comparison to last year. I did buy a $9 retractable clothesline from Menards a few months back and it looks like our bills are very roughly 4 kWh lower per day versus the same year-ago period. Of course air conditioning is mixed in and that’s a monkey wrench. However, they provide average temperature, which is reported to be provided on only 38% of bills per ACEEE. I could do a weather calibration for that. However, I know that is a waste of time because there are other substantial factors – weather independent end uses – that will result in any weather adjustments being far down in the grass of normal usage variation. How about that? There is enough information to do a weather adjustment, which only 1% of customers MAX, could mathematically do, and of that 1% probably only 10% know weather normalization is a waste of time for a single energy bill. (single, not aggregate for a representative sample of a bunch of customers)
What would be useful is a monthly bar chart including the trailing 24 months with overlapping years for monthly comparison. Neither my gas or electric bill has this but my water bill does! Good grief, I buy electricity from a huge utility, natural gas from a dinky regional supplier and I get water from my village – population of the metro area is about 800 (this includes all the zeros – no typos or omissions).
Benchmarking
Benchmarking provides incredibly useful information. Yeah. Let’s do that. The state of Iowa is wanting to do this for (I’m not sure exactly) government facilities including schools. There was an RFP and one (1) proposal was received. Why exactly, I’m not sure but I would say this – I would guess the buyer does not understand how difficult it is to do benchmarking right. It’s like recent rants where I said even measuring ambient outdoor temperature is difficult and the person doing it has to know what they are doing and literally understand heat transfer, including primarily radiation from surrounding objects and convection off the same objects.
Benchmarking requires knowing the type of heating and cooling systems and more specifically, the heating and cooling fuels, square footage, and of course utility consumption. The guy doing the benchmarking has to know whether the results look reasonable. The following are my unscientific estimates for how many benchmarking analyses would be correct for the following methods and skills of the benchmarking guy.
- Blindly collecting square footage data and energy consumption with no ability to do even a laugh test: 35% correct
- Number 1 but throwing out anything that looks really weird, like 50 kWh per square foot for a school or 0.15 therm per square foot for a hospital: 45% correct, not to mention a great many will be discarded
- Number 2 plus contacting the utility to make sure you have all the data for the facility. Many times benchmarking is wrong because there are data missing because not all meters serving the building are included: 55% correct
- Number 3 plus calling the customer to ask them about their heating and cooling systems and fuels used for these systems: 75% correct
- Number 4 but rather than doing a phone call, going on site and looking for meters and systems yourself ensuring you have all the meters serving the building and only the meters serving the building: 92% correct
There you have it. If an experienced expert can do everything in his/her power, there are still things that may not be able to be benchmarked with confidence due to:
- “Campus” meters – here campus being any meter serving multiple buildings (k-12, college/university, health care, military, and even corporate) without submetering on each building.
- Storable fuels like propane, fuel oil, and chicken manure. Tank levels and piles vary from month to month and so determining consumption requires accurate levels plus deliveries.
- No meters – what are you talking about, Jeff? Steam coming from a campus plant with no submetering. You can know how much natural gas the central plant uses or you can guesstimate the consumption eying the pile of chicken manure (or coal) and tracking deliveries. Old central steam plants for example can have rather enormous heat losses to pipe tunnels, making for melted snow and green grass in winter. A good bit of analysis is required to weed this out.
I avoid requests for proposals where I don’t think the buyer understands how difficult it is to do a job I can live with and for those RFPs there is always an ignorant bidder who doesn’t know the difference. Unfortunately, there is no money in telling the buyer what they are asking for is very difficult and that they are going to get crap for results from Cliff Clavin and Associates.
One more thing on benchmarking, total Btu per square foot, mixing all fuels together is a little better than nothing. Electric should always be separated from fossil fuel consumption.
Tidbits
- The incandescent ban advocates are proposing a switch to using lumens as the metric for selecting light bulbs for purchase at your favorite home improvement store. Uh huh. Around 1980 the US was going to be the last country on the globe to convert to metric units. You know base 10 everything with common sense conversions like a milliliter equals a cubic centimeter. Fuggeddboutit! Not gonna happen. There is plenty of fodder for a stand alone rant on this one.
- ACEEE in their Utility Bill study noted above calls utilities “regulated monopolies”. Cool. This is what I’ve called them for years and didn’t know whether this was offensive to them.
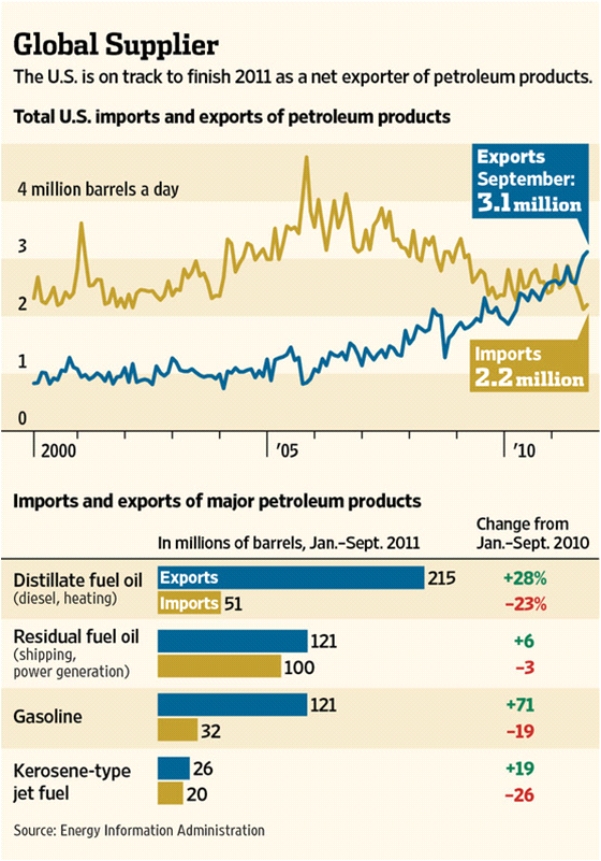
- Lastly – another mind blower – the US is set to become a net exporter of refined petrol products. This is good news if you ask me –a strong manufacturing sector. To clarify just in case – yes, this is refined petroleum products and not crude oil. Many readers were ranting this is misleading – only to a dolt. Plot and data courtesy, The Wall Street Journal.


Join the discussion One Comment