A Better Process
Wouldn’t it be great if it was possible to throw some data at a computer and have it automatically generate a model based on that data? Although machines have yet to take over the world, advances in machine learning are making this scenario plausible in the future. In the meantime, it is possible to develop tools that aid the model generation process and automate some of its steps.
This brief shows output from a script written in the R programming language, which is used to help develop building energy usage models. This script is a program written in R to pull in building energy usage and weather data corresponding to the modeling period, analyze that data and output an energy model for the building. The energy model can then be used to predict the energy usage of the facility when considering energy efficient measures.
Data Exploration
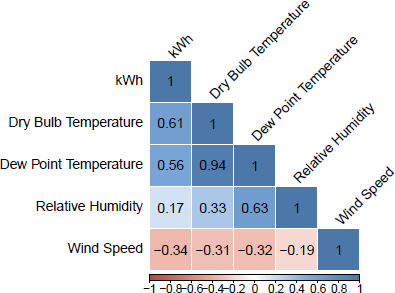
The first step in any data analysis is to generate visualizations that allow the analyst to gain a clear picture of the situation. Along with scatter plots of all the possible model variables over the modeling period, the script displays a correlation chart to give the analyst a sense of what variables to include in the model. Values in the first column close to 1 or -1 show variables that have a high correlation (interdependence) with energy usage.
Developing a Model
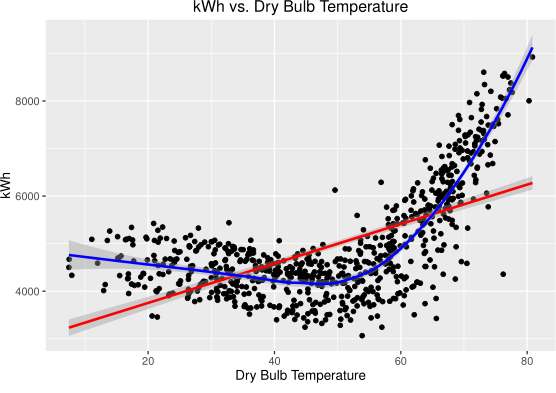
For the sake of simplicity, this brief will focus on the variable with the highest correlation to energy usage, which is the dry bulb temperature. A plot of the temperature vs. kWh shows a simple linear model that follows a general pattern, but seems to miss a couple of significant areas.
A regression is then used on the data to show the relationship of the energy usage to the variables that affect it (in this example, dry bulb temperature). To help improve the accuracy of the model, rather than use a linear regression, the script is updated to use a polynomial regression so it can better trace the curve of the scatter plot.
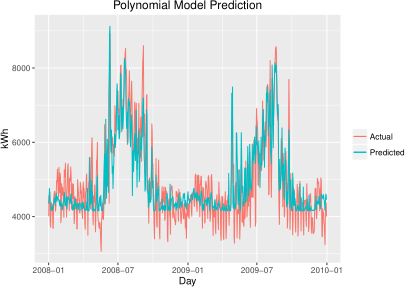
Results
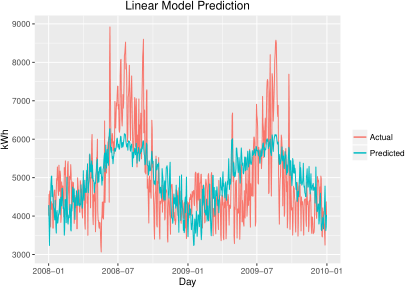
The charts below show the results of the two different models. The second model does a better job of following the curves of energy usage, though there is still room for improvement. In a real scenario, the model would take many more factors into account such as occupancy schedules, weekdays, weekends, and holidays, and change point characteristics.
Final Product
Although a script for model generation does not eliminate the need for human intervention, it can make the process more efficient along with standardizing practices that every analysis requires. A robust script will also allow the analyst to specify parameters for items likely to change for each analysis (variable names, interval periods, model variables, etc.). An intriguing R package, knitr, allows embedding the output of R directly into a Word/PDF document. After a final model is generated, the charts and results generated from a script can be included in a standard report, streamlining customer deliverables, and getting one step closer to automated model generation.